
Yahoo Finance Overview
Contents
Yahoo Finance Overview#
This notebook is primarily meant to act as a brief overview and quick visual reference for how to use the yahoo finance api. Unfortunately, this api isn’t the most stable, so it’s reasonably probable that this notebook will become outdated in the future if I do not keep updating it.
This is the github link to the api’s source repo, which may be useful if you need to get into the weeds of understanding how the api works (I’ve never had the need to do so myself): Source Repo - yfinance
# Import the necessary libraries

import pandas as pd
import numpy as np
from matplotlib import pyplot as plt
from pathlib import Path
import seaborn as sns
import xlwings as xw
import yaml
import yfinance as yf
from typing import List, Dict, Tuple, Optional, Union, Callable, Any, Iterable

# ------------- Now, add a bunch of matplotlib settings and enhancements ----------
# Bunch of default matplotlib setups
plt.style.use('ggplot')
plt.rcParams['figure.figsize'] = [14, 8]


from matplotlib.ticker import FuncFormatter
def percentage_formatter(x, pos):
    ''' Formats the y-axis labels as percentages. '''
    return f'{x:.1%}'

COLOR_SCHEME = [
        "#3f4c60",
        "#93c9f9",
        "#94045b",
        "#83889d",
        "#ffc000",
        "#386f98",
        "#9dabd3",
        "#b80571",
        "#45ad35",
        "#b38825",
        "#525e70",
        "#98bbdc",
        "#aa6597",
        "#6abd5d",
        "#716920",
    ]
def set_mpl_colors() -> None:
    import matplotlib as mpl
    from cycler import cycler
    mpl.rcParams["axes.prop_cycle"] = cycler(color=COLOR_SCHEME)

set_mpl_colors()


# pd.set_option('display.float_format', lambda x: f'{x:,.4}')
Useful Functions#
def color_pos_neg(val):
    '''Format positive numbers in green and negative numbers in red. '''
    color = 'red' if val < 0 else 'green'
    return f'color: {color}'

def display_prettified_df(df: pd.DataFrame) -> None:
    '''Display a dataframe with some nice formatting. '''
    # Copy so that we can modify the dataframe without affecting the original
    df_display = df.copy()

    # Convert the index to strings
    df_display.index = df_display.index.strftime('%Y-%m-%d')

    # Format the numbers
    df_display = df_display.style.format("{:.2%}")

    # Apply the color formatting
    df_display = df_display.applymap(color_pos_neg)

    return df_display
Price & Returns#
The most basic and recurrent task one uses the yfinance api for is downloading price data, typically with the goal of calculating returns. So let’s see it in action.
# Specify the tickers we want to download
TICKERS = ['AAPL','GE','TSLA','AMZN','V','MSFT','XOM']

# Download basic pricing data for all of the tickers in the portfolio
df_data_raw =  yf.download(TICKERS, progress=False)

print(f'Full dataset has {df_data_raw.shape[0]} dates and {df_data_raw.shape[1]} features. '
      f'The default fields pulled are:')
print(df_data_raw.columns.levels[0].to_list(), '\n')

# The data is returned as a multi-indexed column dataframe
#  The multi-index is messy, so let's only display the final 5 rows of the dataset for the 'Adj Close' column
df_data_raw['Adj Close'].tail()
Full dataset has 15587 dates and 42 features. The default fields pulled are:
['Adj Close', 'Close', 'High', 'Low', 'Open', 'Volume']
| AAPL | AMZN | GE | MSFT | TSLA | V | XOM | |
|---|---|---|---|---|---|---|---|
| Date | |||||||
| 2023-11-27 | 189.789993 | 147.729996 | 119.970001 | 378.609985 | 236.080002 | 254.139999 | 103.959999 |
| 2023-11-28 | 190.399994 | 147.029999 | 118.849998 | 382.700012 | 246.720001 | 252.940002 | 103.900002 |
| 2023-11-29 | 189.369995 | 146.320007 | 118.860001 | 378.850006 | 244.139999 | 254.229996 | 102.339996 |
| 2023-11-30 | 189.949997 | 146.089996 | 121.800003 | 378.910004 | 240.080002 | 256.679993 | 102.739998 |
| 2023-12-01 | 191.240005 | 147.029999 | 122.500000 | 374.510010 | 238.830002 | 256.450012 | 102.989998 |
Well that was incredibly simple. Usually, the next step will be to calculate the returns for each security. You do that by grabbing the adjusted close column and calculating the daily % change in the price for each stock.
adj_close_df = df_data_raw['Adj Close']
returns_df = adj_close_df.pct_change().dropna()

display_prettified_df(returns_df.tail())
| AAPL | AMZN | GE | MSFT | TSLA | V | XOM | |
|---|---|---|---|---|---|---|---|
| Date | |||||||
| 2023-11-27 | -0.09% | 0.67% | 0.00% | 0.31% | 0.27% | -0.06% | -0.58% |
| 2023-11-28 | 0.32% | -0.47% | -0.93% | 1.08% | 4.51% | -0.47% | -0.06% |
| 2023-11-29 | -0.54% | -0.48% | 0.01% | -1.01% | -1.05% | 0.51% | -1.50% |
| 2023-11-30 | 0.31% | -0.16% | 2.47% | 0.02% | -1.66% | 0.96% | 0.39% |
| 2023-12-01 | 0.68% | 0.64% | 0.57% | -1.16% | -0.52% | -0.09% | 0.24% |
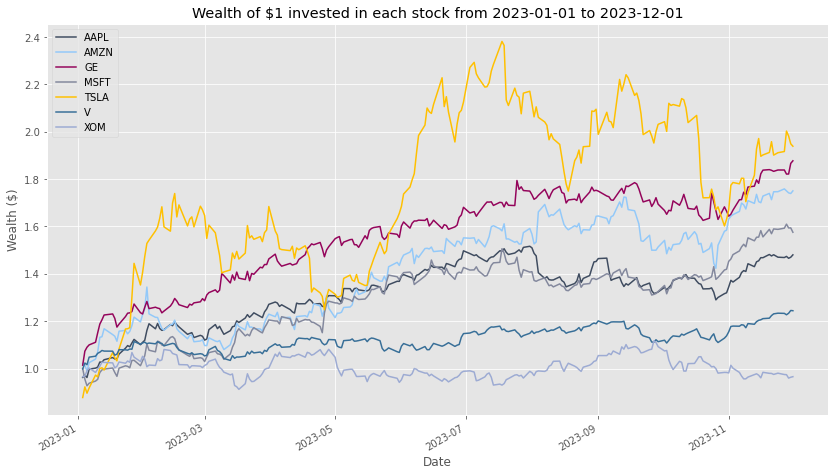
While we are here, might as well display the cumulative of these securities. I’m only going to show the data for the past year, because otherwise Tesla’s ridiculously large returns makes the chart look silly.
filtered_returns = returns_df.loc['2023-01-01':, :].copy()
cumulaitve_returns_df = (1 + filtered_returns).cumprod()
fig, ax = plt.subplots()
cumulaitve_returns_df.plot(ax=ax)
ax.set_title('Wealth of $1 invested in each stock from 2023-01-01 to 2023-12-01')
ax.set_ylabel('Wealth ($)');
Company Info#
If we are trying to get company-specific info, other than prices you neeed to get a ticker object for the security in question. Below is just going to be somewhat cluttered visual guide to the different sort of information you may want to pull from the api.
# Step 1 is always to define the ticker object
aapl = yf.Ticker("aapl")
aapl
yfinance.Ticker object <AAPL>
Info#
info_dict = aapl.info

# Print a bunch of the info
print(f'Industry is: {info_dict["industry"]}')
print(f'Sector is: {info_dict["sector"]}')
print('Current price is: {:.2f}'.format(info_dict['currentPrice']))
print(f'Current bid-ask is: {info_dict["bid"]:.2f} - {info_dict["ask"]:.2f}')
print('Market cap is: {:.2f}'.format(info_dict['marketCap']/1e9), 'B')
print(f'Trailing PE is: {info_dict["trailingPE"]:.2f}')
print(f'Forward PE is: {info_dict["forwardPE"]:.2f}')
print(f'PEG ratio is: {info_dict["pegRatio"]:.2f}')
print(f'Price to book is: {info_dict["priceToBook"]:.2f}')
print(f'Profit margin is: {info_dict["profitMargins"]:.2f}')
print(f'ROE is: {info_dict["returnOnEquity"]:.2f}')
---------------------------------------------------------------------------
KeyError                                  Traceback (most recent call last)
~\AppData\Local\Temp\ipykernel_19060\580852047.py in <module>
      2
      3 # Print a bunch of the info
----> 4 print(f'Industry is: {info_dict["industry"]}')
      5 print(f'Sector is: {info_dict["sector"]}')
      6 print('Current price is: {:.2f}'.format(info_dict['currentPrice']))

KeyError: 'industry'
info_dict
{'address1': 'One Apple Park Way',
 'city': 'Cupertino',
 'state': 'CA',
 'zip': '95014',
 'country': 'United States',
 'phone': '408 996 1010',
 'website': 'https://www.apple.com',
 'industry': 'Consumer Electronics',
 'industryKey': 'consumer-electronics',
 'industryDisp': 'Consumer Electronics',
 'sector': 'Technology',
 'sectorKey': 'technology',
 'sectorDisp': 'Technology',
 'longBusinessSummary': 'Apple Inc. designs, manufactures, and markets smartphones, personal computers, tablets, wearables, and accessories worldwide. The company offers iPhone, a line of smartphones; Mac, a line of personal computers; iPad, a line of multi-purpose tablets; and wearables, home, and accessories comprising AirPods, Apple TV, Apple Watch, Beats products, and HomePod. It also provides AppleCare support and cloud services; and operates various platforms, including the App Store that allow customers to discover and download applications and digital content, such as books, music, video, games, and podcasts. In addition, the company offers various services, such as Apple Arcade, a game subscription service; Apple Fitness+, a personalized fitness service; Apple Music, which offers users a curated listening experience with on-demand radio stations; Apple News+, a subscription news and magazine service; Apple TV+, which offers exclusive original content; Apple Card, a co-branded credit card; and Apple Pay, a cashless payment service, as well as licenses its intellectual property. The company serves consumers, and small and mid-sized businesses; and the education, enterprise, and government markets. It distributes third-party applications for its products through the App Store. The company also sells its products through its retail and online stores, and direct sales force; and third-party cellular network carriers, wholesalers, retailers, and resellers. Apple Inc. was founded in 1976 and is headquartered in Cupertino, California.',
 'fullTimeEmployees': 161000,
 'companyOfficers': [{'maxAge': 1,
   'name': 'Mr. Timothy D. Cook',
   'age': 61,
   'title': 'CEO & Director',
   'yearBorn': 1961,
   'fiscalYear': 2022,
   'totalPay': 16425933,
   'exercisedValue': 0,
   'unexercisedValue': 0},
  {'maxAge': 1,
   'name': 'Mr. Luca  Maestri',
   'age': 59,
   'title': 'CFO & Senior VP',
   'yearBorn': 1963,
   'fiscalYear': 2022,
   'totalPay': 5019783,
   'exercisedValue': 0,
   'unexercisedValue': 0},
  {'maxAge': 1,
   'name': 'Mr. Jeffrey E. Williams',
   'age': 58,
   'title': 'Chief Operating Officer',
   'yearBorn': 1964,
   'fiscalYear': 2022,
   'totalPay': 5018337,
   'exercisedValue': 0,
   'unexercisedValue': 0},
  {'maxAge': 1,
   'name': 'Ms. Katherine L. Adams',
   'age': 58,
   'title': 'Senior VP, General Counsel & Secretary',
   'yearBorn': 1964,
   'fiscalYear': 2022,
   'totalPay': 5015208,
   'exercisedValue': 0,
   'unexercisedValue': 0},
  {'maxAge': 1,
   'name': "Ms. Deirdre  O'Brien",
   'age': 55,
   'title': 'Senior Vice President of Retail',
   'yearBorn': 1967,
   'fiscalYear': 2022,
   'totalPay': 5019783,
   'exercisedValue': 0,
   'unexercisedValue': 0},
  {'maxAge': 1,
   'name': 'Mr. Chris  Kondo',
   'title': 'Senior Director of Corporate Accounting',
   'fiscalYear': 2022,
   'exercisedValue': 0,
   'unexercisedValue': 0},
  {'maxAge': 1,
   'name': 'Mr. James  Wilson',
   'title': 'Chief Technology Officer',
   'fiscalYear': 2022,
   'exercisedValue': 0,
   'unexercisedValue': 0},
  {'maxAge': 1,
   'name': 'Ms. Mary  Demby',
   'title': 'Chief Information Officer',
   'fiscalYear': 2022,
   'exercisedValue': 0,
   'unexercisedValue': 0},
  {'maxAge': 1,
   'name': 'Suhasini  Chandramouli',
   'title': 'Director of Investor Relations',
   'fiscalYear': 2022,
   'exercisedValue': 0,
   'unexercisedValue': 0},
  {'maxAge': 1,
   'name': 'Mr. Greg  Joswiak',
   'title': 'Senior Vice President of Worldwide Marketing',
   'fiscalYear': 2022,
   'exercisedValue': 0,
   'unexercisedValue': 0}],
 'auditRisk': 4,
 'boardRisk': 1,
 'compensationRisk': 6,
 'shareHolderRightsRisk': 1,
 'overallRisk': 1,
 'governanceEpochDate': 1701388800,
 'compensationAsOfEpochDate': 1672444800,
 'maxAge': 86400,
 'priceHint': 2,
 'previousClose': 189.95,
 'open': 190.33,
 'dayLow': 189.23,
 'dayHigh': 191.555,
 'regularMarketPreviousClose': 189.95,
 'regularMarketOpen': 190.33,
 'regularMarketDayLow': 189.23,
 'regularMarketDayHigh': 191.555,
 'dividendRate': 0.96,
 'dividendYield': 0.005,
 'exDividendDate': 1699574400,
 'payoutRatio': 0.1533,
 'fiveYearAvgDividendYield': 0.82,
 'beta': 1.305,
 'trailingPE': 31.146582,
 'forwardPE': 26.746853,
 'volume': 45704823,
 'regularMarketVolume': 45704823,
 'averageVolume': 57299031,
 'averageVolume10days': 41568420,
 'averageDailyVolume10Day': 41568420,
 'bid': 191.3,
 'ask': 191.33,
 'bidSize': 3000,
 'askSize': 1000,
 'marketCap': 2974317543424,
 'fiftyTwoWeekLow': 124.17,
 'fiftyTwoWeekHigh': 198.23,
 'priceToSalesTrailing12Months': 7.7600675,
 'fiftyDayAverage': 179.4516,
 'twoHundredDayAverage': 175.26715,
 'trailingAnnualDividendRate': 0.94,
 'trailingAnnualDividendYield': 0.004948671,
 'currency': 'USD',
 'enterpriseValue': 3036683173888,
 'profitMargins': 0.25305998,
 'floatShares': 15535488445,
 'sharesOutstanding': 15552799744,
 'sharesShort': 105837123,
 'sharesShortPriorMonth': 93026130,
 'sharesShortPreviousMonthDate': 1697155200,
 'dateShortInterest': 1700006400,
 'sharesPercentSharesOut': 0.0068,
 'heldPercentInsiders': 0.00071999995,
 'heldPercentInstitutions': 0.61317,
 'shortRatio': 1.81,
 'shortPercentOfFloat': 0.0068,
 'impliedSharesOutstanding': 15552799744,
 'bookValue': 3.997,
 'priceToBook': 47.845886,
 'lastFiscalYearEnd': 1696032000,
 'nextFiscalYearEnd': 1727654400,
 'mostRecentQuarter': 1696032000,
 'earningsQuarterlyGrowth': 0.108,
 'netIncomeToCommon': 96995000320,
 'trailingEps': 6.14,
 'forwardEps': 7.15,
 'pegRatio': 4.72,
 'lastSplitFactor': '4:1',
 'lastSplitDate': 1598832000,
 'enterpriseToRevenue': 7.923,
 'enterpriseToEbitda': 24.135,
 '52WeekChange': 0.3042351,
 'SandP52WeekChange': 0.14899075,
 'lastDividendValue': 0.24,
 'lastDividendDate': 1699574400,
 'exchange': 'NMS',
 'quoteType': 'EQUITY',
 'symbol': 'AAPL',
 'underlyingSymbol': 'AAPL',
 'shortName': 'Apple Inc.',
 'longName': 'Apple Inc.',
 'firstTradeDateEpochUtc': 345479400,
 'timeZoneFullName': 'America/New_York',
 'timeZoneShortName': 'EST',
 'uuid': '8b10e4ae-9eeb-3684-921a-9ab27e4d87aa',
 'messageBoardId': 'finmb_24937',
 'gmtOffSetMilliseconds': -18000000,
 'currentPrice': 191.24,
 'targetHighPrice': 240.0,
 'targetLowPrice': 159.0,
 'targetMeanPrice': 198.01,
 'targetMedianPrice': 200.0,
 'recommendationMean': 2.1,
 'recommendationKey': 'buy',
 'numberOfAnalystOpinions': 39,
 'totalCash': 61554999296,
 'totalCashPerShare': 3.958,
 'ebitda': 125820002304,
 'totalDebt': 123930001408,
 'quickRatio': 0.843,
 'currentRatio': 0.988,
 'totalRevenue': 383285002240,
 'debtToEquity': 199.418,
 'revenuePerShare': 24.344,
 'returnOnAssets': 0.20256001,
 'returnOnEquity': 1.7195,
 'grossProfits': 170782000000,
 'freeCashflow': 82179997696,
 'operatingCashflow': 110543003648,
 'earningsGrowth': 0.135,
 'revenueGrowth': -0.007,
 'grossMargins': 0.44131002,
 'ebitdaMargins': 0.32827,
 'operatingMargins': 0.30134,
 'financialCurrency': 'USD',
 'trailingPegRatio': 2.2549}
Dividends and Splits#
aapl.actions
| Dividends | Stock Splits | |
|---|---|---|
| Date | ||
| 1987-05-11 00:00:00-04:00 | 0.000536 | 0.0 |
| 1987-06-16 00:00:00-04:00 | 0.000000 | 2.0 |
| 1987-08-10 00:00:00-04:00 | 0.000536 | 0.0 |
| 1987-11-17 00:00:00-05:00 | 0.000714 | 0.0 |
| 1988-02-12 00:00:00-05:00 | 0.000714 | 0.0 |
| ... | ... | ... |
| 2022-11-04 00:00:00-04:00 | 0.230000 | 0.0 |
| 2023-02-10 00:00:00-05:00 | 0.230000 | 0.0 |
| 2023-05-12 00:00:00-04:00 | 0.240000 | 0.0 |
| 2023-08-11 00:00:00-04:00 | 0.240000 | 0.0 |
| 2023-11-10 00:00:00-05:00 | 0.240000 | 0.0 |
86 rows × 2 columns
Options#
Calls#
options_chain = aapl.option_chain()
options_chain.calls.sample(5)
| contractSymbol | lastTradeDate | strike | lastPrice | bid | ask | change | percentChange | volume | openInterest | impliedVolatility | inTheMoney | contractSize | currency | |
|---|---|---|---|---|---|---|---|---|---|---|---|---|---|---|
| 38 | AAPL231208C00240000 | 2023-11-10 15:29:55+00:00 | 240.0 | 0.01 | 0.00 | 0.01 | 0.000000 | 0.000000 | 27.0 | 27 | 0.578129 | False | REGULAR | USD |
| 14 | AAPL231208C00170000 | 2023-12-01 20:57:11+00:00 | 170.0 | 21.40 | 21.20 | 21.75 | 1.199999 | 5.940588 | 389.0 | 533 | 0.542973 | True | REGULAR | USD |
| 2 | AAPL231208C00125000 | 2023-12-01 19:46:08+00:00 | 125.0 | 66.23 | 66.10 | 66.70 | 4.800003 | 7.813777 | 2.0 | 0 | 1.527346 | True | REGULAR | USD |
| 11 | AAPL231208C00162500 | 2023-12-01 20:52:46+00:00 | 162.5 | 28.85 | 28.70 | 29.25 | 28.850000 | NaN | 2.0 | 1 | 0.709964 | True | REGULAR | USD |
| 8 | AAPL231208C00155000 | 2023-12-01 17:19:56+00:00 | 155.0 | 36.26 | 36.15 | 36.75 | 1.709999 | 4.949346 | 2.0 | 80 | 0.862306 | True | REGULAR | USD |
Puts#
options_chain.puts.sample(5)
| contractSymbol | lastTradeDate | strike | lastPrice | bid | ask | change | percentChange | volume | openInterest | impliedVolatility | inTheMoney | contractSize | currency | |
|---|---|---|---|---|---|---|---|---|---|---|---|---|---|---|
| 10 | AAPL231208P00125000 | 2023-12-01 14:31:24+00:00 | 125.0 | 0.01 | 0.0 | 0.01 | 0.000000 | 0.000000 | 201.0 | 781 | 1.062505 | False | REGULAR | USD |
| 9 | AAPL231208P00120000 | 2023-11-28 14:39:19+00:00 | 120.0 | 0.01 | 0.0 | 0.01 | 0.000000 | 0.000000 | 20.0 | 257 | 1.156254 | False | REGULAR | USD |
| 36 | AAPL231208P00200000 | 2023-12-01 20:52:50+00:00 | 200.0 | 8.90 | 8.6 | 9.05 | -1.950001 | -17.972357 | 26.0 | 16 | 0.264656 | True | REGULAR | USD |
| 35 | AAPL231208P00197500 | 2023-12-01 20:57:38+00:00 | 197.5 | 6.35 | 6.0 | 6.55 | 6.350000 | NaN | 124.0 | 6 | 0.208992 | True | REGULAR | USD |
| 34 | AAPL231208P00195000 | 2023-12-01 20:55:13+00:00 | 195.0 | 4.05 | 3.9 | 4.10 | -1.150000 | -22.115377 | 515.0 | 1661 | 0.156258 | True | REGULAR | USD |
Financial Statements#
Balance Sheet#
aapl.balance_sheet
| 2023-09-30 | 2022-09-30 | 2021-09-30 | 2020-09-30 | |
|---|---|---|---|---|
| Treasury Shares Number | 0.0 | NaN | NaN | NaN |
| Ordinary Shares Number | 15550061000.0 | 15943425000.0 | 16426786000.0 | 16976763000.0 |
| Share Issued | 15550061000.0 | 15943425000.0 | 16426786000.0 | 16976763000.0 |
| Net Debt | 81123000000.0 | 96423000000.0 | 89779000000.0 | 74420000000.0 |
| Total Debt | 111088000000.0 | 120069000000.0 | 124719000000.0 | 112436000000.0 |
| Tangible Book Value | 62146000000.0 | 50672000000.0 | 63090000000.0 | 65339000000.0 |
| Invested Capital | 173234000000.0 | 170741000000.0 | 187809000000.0 | 177775000000.0 |
| Working Capital | -1742000000.0 | -18577000000.0 | 9355000000.0 | 38321000000.0 |
| Net Tangible Assets | 62146000000.0 | 50672000000.0 | 63090000000.0 | 65339000000.0 |
| Common Stock Equity | 62146000000.0 | 50672000000.0 | 63090000000.0 | 65339000000.0 |
| Total Capitalization | 157427000000.0 | 149631000000.0 | 172196000000.0 | 164006000000.0 |
| Total Equity Gross Minority Interest | 62146000000.0 | 50672000000.0 | 63090000000.0 | 65339000000.0 |
| Stockholders Equity | 62146000000.0 | 50672000000.0 | 63090000000.0 | 65339000000.0 |
| Gains Losses Not Affecting Retained Earnings | -11452000000.0 | -11109000000.0 | 163000000.0 | -406000000.0 |
| Other Equity Adjustments | -11452000000.0 | NaN | NaN | NaN |
| Retained Earnings | -214000000.0 | -3068000000.0 | 5562000000.0 | 14966000000.0 |
| Capital Stock | 73812000000.0 | 64849000000.0 | 57365000000.0 | 50779000000.0 |
| Common Stock | 73812000000.0 | 64849000000.0 | 57365000000.0 | 50779000000.0 |
| Total Liabilities Net Minority Interest | 290437000000.0 | 302083000000.0 | 287912000000.0 | 258549000000.0 |
| Total Non Current Liabilities Net Minority Interest | 145129000000.0 | 148101000000.0 | 162431000000.0 | 153157000000.0 |
| Other Non Current Liabilities | 49848000000.0 | 49142000000.0 | 53325000000.0 | 54490000000.0 |
| Tradeand Other Payables Non Current | NaN | 16657000000.0 | 24689000000.0 | 28170000000.0 |
| Long Term Debt And Capital Lease Obligation | 95281000000.0 | 98959000000.0 | 109106000000.0 | 98667000000.0 |
| Long Term Debt | 95281000000.0 | 98959000000.0 | 109106000000.0 | 98667000000.0 |
| Current Liabilities | 145308000000.0 | 153982000000.0 | 125481000000.0 | 105392000000.0 |
| Other Current Liabilities | 58829000000.0 | 60845000000.0 | 47493000000.0 | 42684000000.0 |
| Current Deferred Liabilities | 8061000000.0 | 7912000000.0 | 7612000000.0 | 6643000000.0 |
| Current Deferred Revenue | 8061000000.0 | 7912000000.0 | 7612000000.0 | 6643000000.0 |
| Current Debt And Capital Lease Obligation | 15807000000.0 | 21110000000.0 | 15613000000.0 | 13769000000.0 |
| Current Debt | 15807000000.0 | 21110000000.0 | 15613000000.0 | 13769000000.0 |
| Other Current Borrowings | 9822000000.0 | 11128000000.0 | 9613000000.0 | 8773000000.0 |
| Commercial Paper | 5985000000.0 | 9982000000.0 | 6000000000.0 | 4996000000.0 |
| Payables And Accrued Expenses | 62611000000.0 | 64115000000.0 | 54763000000.0 | 42296000000.0 |
| Payables | 62611000000.0 | 64115000000.0 | 54763000000.0 | 42296000000.0 |
| Accounts Payable | 62611000000.0 | 64115000000.0 | 54763000000.0 | 42296000000.0 |
| Total Assets | 352583000000.0 | 352755000000.0 | 351002000000.0 | 323888000000.0 |
| Total Non Current Assets | 209017000000.0 | 217350000000.0 | 216166000000.0 | 180175000000.0 |
| Other Non Current Assets | 64758000000.0 | 54428000000.0 | 48849000000.0 | 42522000000.0 |
| Investments And Advances | 100544000000.0 | 120805000000.0 | 127877000000.0 | 100887000000.0 |
| Other Investments | NaN | 120805000000.0 | 127877000000.0 | 100887000000.0 |
| Investmentin Financial Assets | 100544000000.0 | 120805000000.0 | 127877000000.0 | 100887000000.0 |
| Available For Sale Securities | 100544000000.0 | 120805000000.0 | 127877000000.0 | 100887000000.0 |
| Net PPE | 43715000000.0 | 42117000000.0 | 39440000000.0 | 36766000000.0 |
| Accumulated Depreciation | NaN | -72340000000.0 | -70283000000.0 | -66760000000.0 |
| Gross PPE | NaN | 114457000000.0 | 109723000000.0 | 103526000000.0 |
| Leases | NaN | 11271000000.0 | 11023000000.0 | 10283000000.0 |
| Machinery Furniture Equipment | NaN | 81060000000.0 | 78659000000.0 | 75291000000.0 |
| Land And Improvements | NaN | 22126000000.0 | 20041000000.0 | 17952000000.0 |
| Properties | NaN | 0.0 | 0.0 | 0.0 |
| Current Assets | 143566000000.0 | 135405000000.0 | 134836000000.0 | 143713000000.0 |
| Other Current Assets | 14695000000.0 | 21223000000.0 | 14111000000.0 | 11264000000.0 |
| Inventory | 6331000000.0 | 4946000000.0 | 6580000000.0 | 4061000000.0 |
| Receivables | 60985000000.0 | 60932000000.0 | 51506000000.0 | 37445000000.0 |
| Other Receivables | 31477000000.0 | 32748000000.0 | 25228000000.0 | 21325000000.0 |
| Accounts Receivable | 29508000000.0 | 28184000000.0 | 26278000000.0 | 16120000000.0 |
| Cash Cash Equivalents And Short Term Investments | 61555000000.0 | 48304000000.0 | 62639000000.0 | 90943000000.0 |
| Other Short Term Investments | 31590000000.0 | 24658000000.0 | 27699000000.0 | 52927000000.0 |
| Cash And Cash Equivalents | 29965000000.0 | 23646000000.0 | 34940000000.0 | 38016000000.0 |
| Cash Equivalents | NaN | 5100000000.0 | 17635000000.0 | 20243000000.0 |
| Cash Financial | NaN | 18546000000.0 | 17305000000.0 | 17773000000.0 |
Cash Flow Statement#
aapl.cash_flow
| 2023-09-30 | 2022-09-30 | 2021-09-30 | 2020-09-30 | |
|---|---|---|---|---|
| Free Cash Flow | 99584000000.0 | 111443000000.0 | 92953000000.0 | 73365000000.0 |
| Repurchase Of Capital Stock | -77550000000.0 | -89402000000.0 | -85971000000.0 | -72358000000.0 |
| Repayment Of Debt | -11151000000.0 | -9543000000.0 | -8750000000.0 | -13592000000.0 |
| Issuance Of Debt | 5228000000.0 | 9420000000.0 | 20393000000.0 | 16091000000.0 |
| Issuance Of Capital Stock | NaN | NaN | 1105000000.0 | 880000000.0 |
| Capital Expenditure | -10959000000.0 | -10708000000.0 | -11085000000.0 | -7309000000.0 |
| Interest Paid Supplemental Data | 3803000000.0 | 2865000000.0 | 2687000000.0 | 3002000000.0 |
| Income Tax Paid Supplemental Data | 18679000000.0 | 19573000000.0 | 25385000000.0 | 9501000000.0 |
| End Cash Position | 30737000000.0 | 24977000000.0 | 35929000000.0 | 39789000000.0 |
| Beginning Cash Position | 24977000000.0 | 35929000000.0 | 39789000000.0 | 50224000000.0 |
| Changes In Cash | 5760000000.0 | -10952000000.0 | -3860000000.0 | -10435000000.0 |
| Financing Cash Flow | -108488000000.0 | -110749000000.0 | -93353000000.0 | -86820000000.0 |
| Cash Flow From Continuing Financing Activities | -108488000000.0 | -110749000000.0 | -93353000000.0 | -86820000000.0 |
| Net Other Financing Charges | -6012000000.0 | -6383000000.0 | -6685000000.0 | -3760000000.0 |
| Cash Dividends Paid | -15025000000.0 | -14841000000.0 | -14467000000.0 | -14081000000.0 |
| Common Stock Dividend Paid | -15025000000.0 | -14841000000.0 | -14467000000.0 | -14081000000.0 |
| Net Common Stock Issuance | -77550000000.0 | -89402000000.0 | -84866000000.0 | -71478000000.0 |
| Common Stock Payments | -77550000000.0 | -89402000000.0 | -85971000000.0 | -72358000000.0 |
| Common Stock Issuance | NaN | NaN | 1105000000.0 | 880000000.0 |
| Net Issuance Payments Of Debt | -9901000000.0 | -123000000.0 | 12665000000.0 | 2499000000.0 |
| Net Short Term Debt Issuance | -3978000000.0 | 3955000000.0 | 1022000000.0 | -963000000.0 |
| Short Term Debt Payments | NaN | NaN | NaN | -963000000.0 |
| Short Term Debt Issuance | NaN | 3955000000.0 | NaN | NaN |
| Net Long Term Debt Issuance | -5923000000.0 | -4078000000.0 | 11643000000.0 | 3462000000.0 |
| Long Term Debt Payments | -11151000000.0 | -9543000000.0 | -8750000000.0 | -12629000000.0 |
| Long Term Debt Issuance | 5228000000.0 | 5465000000.0 | 20393000000.0 | 16091000000.0 |
| Investing Cash Flow | 3705000000.0 | -22354000000.0 | -14545000000.0 | -4289000000.0 |
| Cash Flow From Continuing Investing Activities | 3705000000.0 | -22354000000.0 | -14545000000.0 | -4289000000.0 |
| Net Other Investing Changes | -1337000000.0 | -1780000000.0 | -352000000.0 | -791000000.0 |
| Net Investment Purchase And Sale | 16001000000.0 | -9560000000.0 | -3075000000.0 | 5335000000.0 |
| Sale Of Investment | 45514000000.0 | 67363000000.0 | 106483000000.0 | 120483000000.0 |
| Purchase Of Investment | -29513000000.0 | -76923000000.0 | -109558000000.0 | -115148000000.0 |
| Net Business Purchase And Sale | NaN | -306000000.0 | -33000000.0 | -1524000000.0 |
| Purchase Of Business | NaN | -306000000.0 | -33000000.0 | -1524000000.0 |
| Net PPE Purchase And Sale | -10959000000.0 | -10708000000.0 | -11085000000.0 | -7309000000.0 |
| Purchase Of PPE | -10959000000.0 | -10708000000.0 | -11085000000.0 | -7309000000.0 |
| Operating Cash Flow | 110543000000.0 | 122151000000.0 | 104038000000.0 | 80674000000.0 |
| Cash Flow From Continuing Operating Activities | 110543000000.0 | 122151000000.0 | 104038000000.0 | 80674000000.0 |
| Change In Working Capital | -6577000000.0 | 1200000000.0 | -4911000000.0 | 5690000000.0 |
| Change In Other Working Capital | NaN | 478000000.0 | 1676000000.0 | 2081000000.0 |
| Change In Other Current Liabilities | 3031000000.0 | 5632000000.0 | 5799000000.0 | 8916000000.0 |
| Change In Other Current Assets | -5684000000.0 | -6499000000.0 | -8042000000.0 | -9588000000.0 |
| Change In Payables And Accrued Expense | -1889000000.0 | 9448000000.0 | 12326000000.0 | -4062000000.0 |
| Change In Payable | -1889000000.0 | 9448000000.0 | 12326000000.0 | -4062000000.0 |
| Change In Account Payable | -1889000000.0 | 9448000000.0 | 12326000000.0 | -4062000000.0 |
| Change In Inventory | -1618000000.0 | 1484000000.0 | -2642000000.0 | -127000000.0 |
| Change In Receivables | -417000000.0 | -9343000000.0 | -14028000000.0 | 8470000000.0 |
| Changes In Account Receivables | -1688000000.0 | -1823000000.0 | -10125000000.0 | 6917000000.0 |
| Other Non Cash Items | -2227000000.0 | 111000000.0 | -147000000.0 | -97000000.0 |
| Stock Based Compensation | 10833000000.0 | 9038000000.0 | 7906000000.0 | 6829000000.0 |
| Deferred Tax | NaN | 895000000.0 | -4774000000.0 | -215000000.0 |
| Deferred Income Tax | NaN | 895000000.0 | -4774000000.0 | -215000000.0 |
| Depreciation Amortization Depletion | 11519000000.0 | 11104000000.0 | 11284000000.0 | 11056000000.0 |
| Depreciation And Amortization | 11519000000.0 | 11104000000.0 | 11284000000.0 | 11056000000.0 |
| Net Income From Continuing Operations | 96995000000.0 | 99803000000.0 | 94680000000.0 | 57411000000.0 |
Income Statement#
aapl.income_stmt
| 2023-09-30 | 2022-09-30 | 2021-09-30 | 2020-09-30 | |
|---|---|---|---|---|
| Tax Effect Of Unusual Items | 0.0 | 0.0 | 0.0 | 0.0 |
| Tax Rate For Calcs | 0.147192 | 0.162045 | 0.133023 | 0.144282 |
| Normalized EBITDA | 125820000000.0 | 130541000000.0 | 120233000000.0 | 77344000000.0 |
| Net Income From Continuing Operation Net Minority Interest | 96995000000.0 | 99803000000.0 | 94680000000.0 | 57411000000.0 |
| Reconciled Depreciation | 11519000000.0 | 11104000000.0 | 11284000000.0 | 11056000000.0 |
| Reconciled Cost Of Revenue | 214137000000.0 | 223546000000.0 | 212981000000.0 | 169559000000.0 |
| EBITDA | 125820000000.0 | 130541000000.0 | 120233000000.0 | 77344000000.0 |
| EBIT | 114301000000.0 | 119437000000.0 | 108949000000.0 | 66288000000.0 |
| Net Interest Income | NaN | -106000000.0 | 198000000.0 | 890000000.0 |
| Interest Expense | NaN | 2931000000.0 | 2645000000.0 | 2873000000.0 |
| Interest Income | NaN | 2825000000.0 | 2843000000.0 | 3763000000.0 |
| Normalized Income | 96995000000.0 | 99803000000.0 | 94680000000.0 | 57411000000.0 |
| Net Income From Continuing And Discontinued Operation | 96995000000.0 | 99803000000.0 | 94680000000.0 | 57411000000.0 |
| Total Expenses | 268984000000.0 | 274891000000.0 | 256868000000.0 | 208227000000.0 |
| Total Operating Income As Reported | 114301000000.0 | 119437000000.0 | 108949000000.0 | 66288000000.0 |
| Diluted Average Shares | 15812547000.0 | 16325819000.0 | 16864919000.0 | 17528214000.0 |
| Basic Average Shares | 15744231000.0 | 16215963000.0 | 16701272000.0 | 17352119000.0 |
| Diluted EPS | 6.13 | 6.11 | 5.61 | 3.28 |
| Basic EPS | 6.16 | 6.15 | 5.67 | 3.31 |
| Diluted NI Availto Com Stockholders | 96995000000.0 | 99803000000.0 | 94680000000.0 | 57411000000.0 |
| Net Income Common Stockholders | 96995000000.0 | 99803000000.0 | 94680000000.0 | 57411000000.0 |
| Net Income | 96995000000.0 | 99803000000.0 | 94680000000.0 | 57411000000.0 |
| Net Income Including Noncontrolling Interests | 96995000000.0 | 99803000000.0 | 94680000000.0 | 57411000000.0 |
| Net Income Continuous Operations | 96995000000.0 | 99803000000.0 | 94680000000.0 | 57411000000.0 |
| Tax Provision | 16741000000.0 | 19300000000.0 | 14527000000.0 | 9680000000.0 |
| Pretax Income | 113736000000.0 | 119103000000.0 | 109207000000.0 | 67091000000.0 |
| Other Income Expense | -565000000.0 | -334000000.0 | 258000000.0 | 803000000.0 |
| Other Non Operating Income Expenses | -565000000.0 | -334000000.0 | 258000000.0 | 803000000.0 |
| Net Non Operating Interest Income Expense | NaN | -106000000.0 | 198000000.0 | 890000000.0 |
| Interest Expense Non Operating | NaN | 2931000000.0 | 2645000000.0 | 2873000000.0 |
| Interest Income Non Operating | NaN | 2825000000.0 | 2843000000.0 | 3763000000.0 |
| Operating Income | 114301000000.0 | 119437000000.0 | 108949000000.0 | 66288000000.0 |
| Operating Expense | 54847000000.0 | 51345000000.0 | 43887000000.0 | 38668000000.0 |
| Research And Development | 29915000000.0 | 26251000000.0 | 21914000000.0 | 18752000000.0 |
| Selling General And Administration | 24932000000.0 | 25094000000.0 | 21973000000.0 | 19916000000.0 |
| Gross Profit | 169148000000.0 | 170782000000.0 | 152836000000.0 | 104956000000.0 |
| Cost Of Revenue | 214137000000.0 | 223546000000.0 | 212981000000.0 | 169559000000.0 |
| Total Revenue | 383285000000.0 | 394328000000.0 | 365817000000.0 | 274515000000.0 |
| Operating Revenue | 383285000000.0 | 394328000000.0 | 365817000000.0 | 274515000000.0 |
News#
all_news = aapl.news
all_news
[{'uuid': 'e79e2b6e-3d62-39dc-96d2-6be830b66adc',
  'title': '3 Top Gaming Stocks to Buy in December',
  'publisher': 'Motley Fool',
  'link': 'https://finance.yahoo.com/m/e79e2b6e-3d62-39dc-96d2-6be830b66adc/3-top-gaming-stocks-to-buy-in.html',
  'providerPublishTime': 1701623220,
  'type': 'STORY',
  'thumbnail': {'resolutions': [{'url': 'https://s.yimg.com/uu/api/res/1.2/Udxno8.0fpikKVWqeDsnLg--~B/aD0xNDE0O3c9MjEyMTthcHBpZD15dGFjaHlvbg--/https://media.zenfs.com/en/motleyfool.com/776ad56541b6c3aba48c345556bf5739',
     'width': 2121,
     'height': 1414,
     'tag': 'original'},
    {'url': 'https://s.yimg.com/uu/api/res/1.2/Gs1Xa7bI2hRYDKPZvPQiDw--~B/Zmk9ZmlsbDtoPTE0MDtweW9mZj0wO3c9MTQwO2FwcGlkPXl0YWNoeW9u/https://media.zenfs.com/en/motleyfool.com/776ad56541b6c3aba48c345556bf5739',
     'width': 140,
     'height': 140,
     'tag': '140x140'}]},
  'relatedTickers': ['NVDA', 'MSFT', 'AAPL']},
 {'uuid': 'a0e4f0cb-066f-3814-b606-112aebcc5460',
  'title': 'Apple Is Far Less Important to Berkshire Hathaway Than You Think',
  'publisher': 'Motley Fool',
  'link': 'https://finance.yahoo.com/m/a0e4f0cb-066f-3814-b606-112aebcc5460/apple-is-far-less-important.html',
  'providerPublishTime': 1701617520,
  'type': 'STORY',
  'thumbnail': {'resolutions': [{'url': 'https://s.yimg.com/uu/api/res/1.2/HPQLvtcvwMwhf0YmaZZYew--~B/aD04MDA7dz0xMjAwO2FwcGlkPXl0YWNoeW9u/https://media.zenfs.com/en/motleyfool.com/954821dc6ee1117bebeabde3e1b8605e',
     'width': 1200,
     'height': 800,
     'tag': 'original'},
    {'url': 'https://s.yimg.com/uu/api/res/1.2/52ZzekBGt9V2v0IerOZOMQ--~B/Zmk9ZmlsbDtoPTE0MDtweW9mZj0wO3c9MTQwO2FwcGlkPXl0YWNoeW9u/https://media.zenfs.com/en/motleyfool.com/954821dc6ee1117bebeabde3e1b8605e',
     'width': 140,
     'height': 140,
     'tag': '140x140'}]},
  'relatedTickers': ['BRK-B', 'AAPL']},
 {'uuid': 'e03b907f-8ca9-3279-ac1d-3c815e8d375f',
  'title': 'These 3 Stocks Might Be Getting a Little Too Expensive',
  'publisher': 'Motley Fool',
  'link': 'https://finance.yahoo.com/m/e03b907f-8ca9-3279-ac1d-3c815e8d375f/these-3-stocks-might-be.html',
  'providerPublishTime': 1701616200,
  'type': 'STORY',
  'thumbnail': {'resolutions': [{'url': 'https://s.yimg.com/uu/api/res/1.2/5N0XiOGpejeRphSa29u.vQ--~B/aD0xNDE0O3c9MjEyMDthcHBpZD15dGFjaHlvbg--/https://media.zenfs.com/en/motleyfool.com/1397339891bbc6f110494baaded487a8',
     'width': 2120,
     'height': 1414,
     'tag': 'original'},
    {'url': 'https://s.yimg.com/uu/api/res/1.2/.zibVedpxgyr6A.1kO_BzQ--~B/Zmk9ZmlsbDtoPTE0MDtweW9mZj0wO3c9MTQwO2FwcGlkPXl0YWNoeW9u/https://media.zenfs.com/en/motleyfool.com/1397339891bbc6f110494baaded487a8',
     'width': 140,
     'height': 140,
     'tag': '140x140'}]},
  'relatedTickers': ['CMG', 'AAPL', 'TSLA', 'COMP']},
 {'uuid': 'acb4f183-c37b-3939-9577-89303a60ddb4',
  'title': 'After Soaring in 2023, Is Apple a Smart Stock to Buy in 2024?',
  'publisher': 'Motley Fool',
  'link': 'https://finance.yahoo.com/m/acb4f183-c37b-3939-9577-89303a60ddb4/after-soaring-in-2023%2C-is.html',
  'providerPublishTime': 1701613800,
  'type': 'STORY',
  'thumbnail': {'resolutions': [{'url': 'https://s.yimg.com/uu/api/res/1.2/D7pbLDLUmn0snJFQ2AO5Dg--~B/aD0xNDEyO3c9MjEyMjthcHBpZD15dGFjaHlvbg--/https://media.zenfs.com/en/motleyfool.com/19cee92a7f64257f4f56432c7ebf3fb5',
     'width': 2122,
     'height': 1412,
     'tag': 'original'},
    {'url': 'https://s.yimg.com/uu/api/res/1.2/TmAseS.OUqAFz6e1vwpSsw--~B/Zmk9ZmlsbDtoPTE0MDtweW9mZj0wO3c9MTQwO2FwcGlkPXl0YWNoeW9u/https://media.zenfs.com/en/motleyfool.com/19cee92a7f64257f4f56432c7ebf3fb5',
     'width': 140,
     'height': 140,
     'tag': '140x140'}]},
  'relatedTickers': ['AAPL']},
 {'uuid': '82188e4b-69e2-39c6-a2cb-8ab878bc9900',
  'title': 'Chase could become the next Apple Card partner',
  'publisher': 'AppleInsider',
  'link': 'https://finance.yahoo.com/m/82188e4b-69e2-39c6-a2cb-8ab878bc9900/chase-could-become-the-next.html',
  'providerPublishTime': 1701613419,
  'type': 'STORY',
  'thumbnail': {'resolutions': [{'url': 'https://s.yimg.com/uu/api/res/1.2/5dsxunfLRdOdLF8_ZNz0AA--~B/aD02NzU7dz0xMjAwO2FwcGlkPXl0YWNoeW9u/https://media.zenfs.com/en/appleinsider_865/2ec6bc68580fc900fdb09266c01f488b',
     'width': 1200,
     'height': 675,
     'tag': 'original'},
    {'url': 'https://s.yimg.com/uu/api/res/1.2/lNdltd_tzDYaEzEJPDM4uA--~B/Zmk9ZmlsbDtoPTE0MDtweW9mZj0wO3c9MTQwO2FwcGlkPXl0YWNoeW9u/https://media.zenfs.com/en/appleinsider_865/2ec6bc68580fc900fdb09266c01f488b',
     'width': 140,
     'height': 140,
     'tag': '140x140'}]},
  'relatedTickers': ['AAPL']},
 {'uuid': 'dc3885a2-ef90-3abb-8df6-0b1a40642320',
  'title': '15 Biggest Countries that Qualify for the Green Card Lottery',
  'publisher': 'Insider Monkey',
  'link': 'https://finance.yahoo.com/news/15-biggest-countries-qualify-green-133837560.html',
  'providerPublishTime': 1701610717,
  'type': 'STORY',
  'thumbnail': {'resolutions': [{'url': 'https://s.yimg.com/uu/api/res/1.2/BNfRpzG3Jevt.MjwXnj29Q--~B/aD02MDA7dz03NTA7YXBwaWQ9eXRhY2h5b24-/https://media.zenfs.com/en/insidermonkey.com/b7ea8d861c10aeac5a133147f597fac7',
     'width': 750,
     'height': 600,
     'tag': 'original'},
    {'url': 'https://s.yimg.com/uu/api/res/1.2/TVktBp4yl1c8Tud_EFcXzQ--~B/Zmk9ZmlsbDtoPTE0MDtweW9mZj0wO3c9MTQwO2FwcGlkPXl0YWNoeW9u/https://media.zenfs.com/en/insidermonkey.com/b7ea8d861c10aeac5a133147f597fac7',
     'width': 140,
     'height': 140,
     'tag': '140x140'}]},
  'relatedTickers': ['AAPL', 'AMZN', 'TSLA']},
 {'uuid': '40fc9efa-1518-305b-aa62-a911db207de3',
  'title': 'These 2 Artificial Intelligence (AI) Stocks Could Zoom Past $4 Trillion in 2024, According to Wall Street',
  'publisher': 'Motley Fool',
  'link': 'https://finance.yahoo.com/m/40fc9efa-1518-305b-aa62-a911db207de3/these-2-artificial.html',
  'providerPublishTime': 1701609300,
  'type': 'STORY',
  'thumbnail': {'resolutions': [{'url': 'https://s.yimg.com/uu/api/res/1.2/eqa7KB_1TlEWY8tnv25BpA--~B/aD02NDY7dz0xMjAwO2FwcGlkPXl0YWNoeW9u/https://media.zenfs.com/en/motleyfool.com/4f5a1eb0f0cec37fcaec986b20f91784',
     'width': 1200,
     'height': 646,
     'tag': 'original'},
    {'url': 'https://s.yimg.com/uu/api/res/1.2/wfRsDLZ.U5DikHuq0vX6FQ--~B/Zmk9ZmlsbDtoPTE0MDtweW9mZj0wO3c9MTQwO2FwcGlkPXl0YWNoeW9u/https://media.zenfs.com/en/motleyfool.com/4f5a1eb0f0cec37fcaec986b20f91784',
     'width': 140,
     'height': 140,
     'tag': '140x140'}]},
  'relatedTickers': ['AAPL', 'MSFT']},
 {'uuid': '930739e7-5793-30a3-a16f-789d4728dfef',
  'title': 'Apple Stock: Buy, Sell, or Hold?',
  'publisher': 'Motley Fool',
  'link': 'https://finance.yahoo.com/m/930739e7-5793-30a3-a16f-789d4728dfef/apple-stock%3A-buy%2C-sell%2C-or.html',
  'providerPublishTime': 1701607500,
  'type': 'STORY',
  'thumbnail': {'resolutions': [{'url': 'https://s.yimg.com/uu/api/res/1.2/GEI.8fOhnEMYP_TzCh7zIA--~B/aD0xNDE0O3c9MjEyMTthcHBpZD15dGFjaHlvbg--/https://media.zenfs.com/en/motleyfool.com/6d346c3f18b16d4c5a176387c31802a2',
     'width': 2121,
     'height': 1414,
     'tag': 'original'},
    {'url': 'https://s.yimg.com/uu/api/res/1.2/Y9pUfdiSz9FXiulgLprg8g--~B/Zmk9ZmlsbDtoPTE0MDtweW9mZj0wO3c9MTQwO2FwcGlkPXl0YWNoeW9u/https://media.zenfs.com/en/motleyfool.com/6d346c3f18b16d4c5a176387c31802a2',
     'width': 140,
     'height': 140,
     'tag': '140x140'}]},
  'relatedTickers': ['AAPL']}]
ISIN#
aapl.isin
'US0378331005'
Institutional Holders#
aapl.institutional_holders
| Holder | Shares | Date Reported | % Out | Value | |
|---|---|---|---|---|---|
| 0 | Vanguard Group Inc | 1299997133 | 2023-09-29 | 0.0836 | 248611458856 |
| 1 | Blackrock Inc. | 1031407553 | 2023-09-29 | 0.0663 | 197246386101 |
| 2 | Berkshire Hathaway, Inc | 915560382 | 2023-09-29 | 0.0589 | 175091772483 |
| 3 | State Street Corporation | 569291690 | 2023-09-29 | 0.0366 | 108871345922 |
| 4 | FMR, LLC | 298321726 | 2023-09-29 | 0.0192 | 57051048518 |
| 5 | Geode Capital Management, LLC | 296103070 | 2023-09-29 | 0.0190 | 56626752733 |
| 6 | Price (T.Rowe) Associates Inc | 216307878 | 2023-09-29 | 0.0139 | 41366719776 |
| 7 | Morgan Stanley | 206732960 | 2023-09-29 | 0.0133 | 39535612406 |
| 8 | Northern Trust Corporation | 168874976 | 2023-09-29 | 0.0109 | 32295651337 |
| 9 | Norges Bank Investment Management | 167374278 | 2022-12-30 | 0.0108 | 32008657844 |
Prices#
# Show how the adjusted close price is calculated
history_df = aapl.history(period="max")
history_df
| Open | High | Low | Close | Volume | Dividends | Stock Splits | |
|---|---|---|---|---|---|---|---|
| Date | |||||||
| 1980-12-12 00:00:00-05:00 | 0.099319 | 0.099750 | 0.099319 | 0.099319 | 469033600 | 0.0 | 0.0 |
| 1980-12-15 00:00:00-05:00 | 0.094569 | 0.094569 | 0.094137 | 0.094137 | 175884800 | 0.0 | 0.0 |
| 1980-12-16 00:00:00-05:00 | 0.087660 | 0.087660 | 0.087228 | 0.087228 | 105728000 | 0.0 | 0.0 |
| 1980-12-17 00:00:00-05:00 | 0.089387 | 0.089818 | 0.089387 | 0.089387 | 86441600 | 0.0 | 0.0 |
| 1980-12-18 00:00:00-05:00 | 0.091978 | 0.092410 | 0.091978 | 0.091978 | 73449600 | 0.0 | 0.0 |
| ... | ... | ... | ... | ... | ... | ... | ... |
| 2023-11-27 00:00:00-05:00 | 189.919998 | 190.669998 | 188.899994 | 189.789993 | 40552600 | 0.0 | 0.0 |
| 2023-11-28 00:00:00-05:00 | 189.779999 | 191.080002 | 189.399994 | 190.399994 | 38415400 | 0.0 | 0.0 |
| 2023-11-29 00:00:00-05:00 | 190.899994 | 192.089996 | 188.970001 | 189.369995 | 43014200 | 0.0 | 0.0 |
| 2023-11-30 00:00:00-05:00 | 189.839996 | 190.320007 | 188.190002 | 189.949997 | 48794400 | 0.0 | 0.0 |
| 2023-12-01 00:00:00-05:00 | 190.330002 | 191.559998 | 189.229996 | 191.240005 | 45679300 | 0.0 | 0.0 |
10834 rows × 7 columns
Adjusted Prices#
A brief aside on what adjusted prices are, how yahoo finance calculates them, and what I think about it.